


Key takeaways:
-
Roughly 1.7 million ETH ($7.5 billion) were accumulated in the $4,300 to $4,400 range, creating strong support.
-
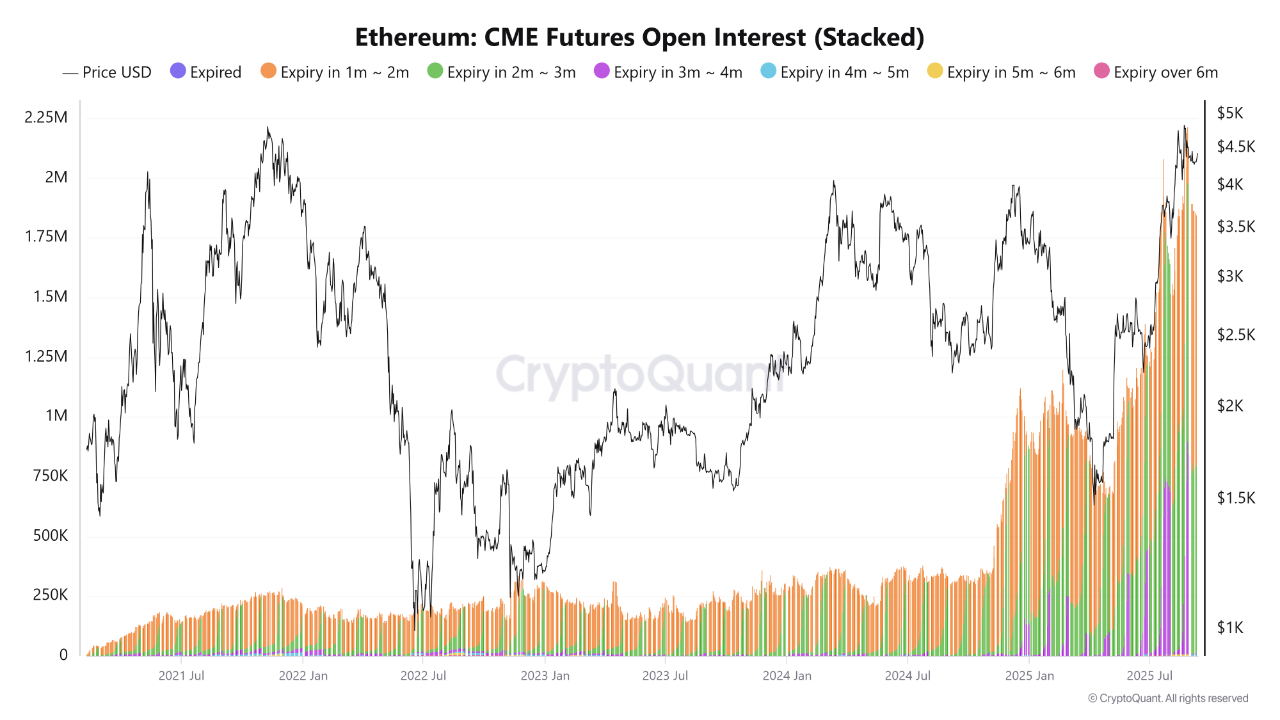
Institutional demand surges as CME open interest hits all-time highs with short-term maturities dominating.
-
$4,500 remains critical for Ether, with a breakout triggering upside, but dips to $4,000 can’t be ruled out.
Ether (ETH) continues to trade sideways between $4,500 and $4,200 this month, showing signs of fading momentum. The lack of decisive buying pressure indicates concerns about short-term weakness, but onchain data suggests a deeper accumulation trend may be underway.
Data from CryptoQuant highlights a critical development around the $4,300–$4,400 zone. Roughly 1.7 million ETH, i.e., $7.5 billion, has been absorbed into accumulation addresses at this level, with many withdrawals from centralized exchanges reflecting an average cost basis near $4,300. This establishes a strong zone of interest that could serve as key support if price tests lower levels again.
Exchange flow analysis shows that Binance has played a significant role in this process, handling the largest outflows during the accumulation phase. Interestingly, addresses depositing ETH onto Binance show an average cost basis closer to $3,150, suggesting divergent positioning between long-term holders and active traders.
Institutional flows are also shaping the current market. Open interest (OI) on CME has surged to all-time highs, with a heavy concentration in short-term maturities (one to three months).
While this raises volatility risk around contract expirations, it also signals aggressive institutional participation. Longer-term maturities (three to six months) are also building, reflecting stronger confidence in Ether’s outlook.
With ETH trading near $5,000, Crypto analyst Pelin Ay noted that the above institutional demand and derivatives positioning suggest further upside. While liquidation risks remain elevated, the analyst argues the broader trend remains intact. Pelin said,
“My expectation is that ETH could reach the $6,800 resistance level by year end.”
Related: Latin American devs favor Ethereum and Polygon over new chains: Report
$4,500 remains the key inflection level for Ether
From a technical standpoint, lower time frames continue to show indecision for Ether. The asset has largely ranged between $4,200 and $4,500 throughout September, while crypto assets like Bitcoin and Solana have exhibited higher highs. This divergence points to short-term capital rotation into other majors, though a decisive break above $4,500 could quickly shift momentum back toward Ether.
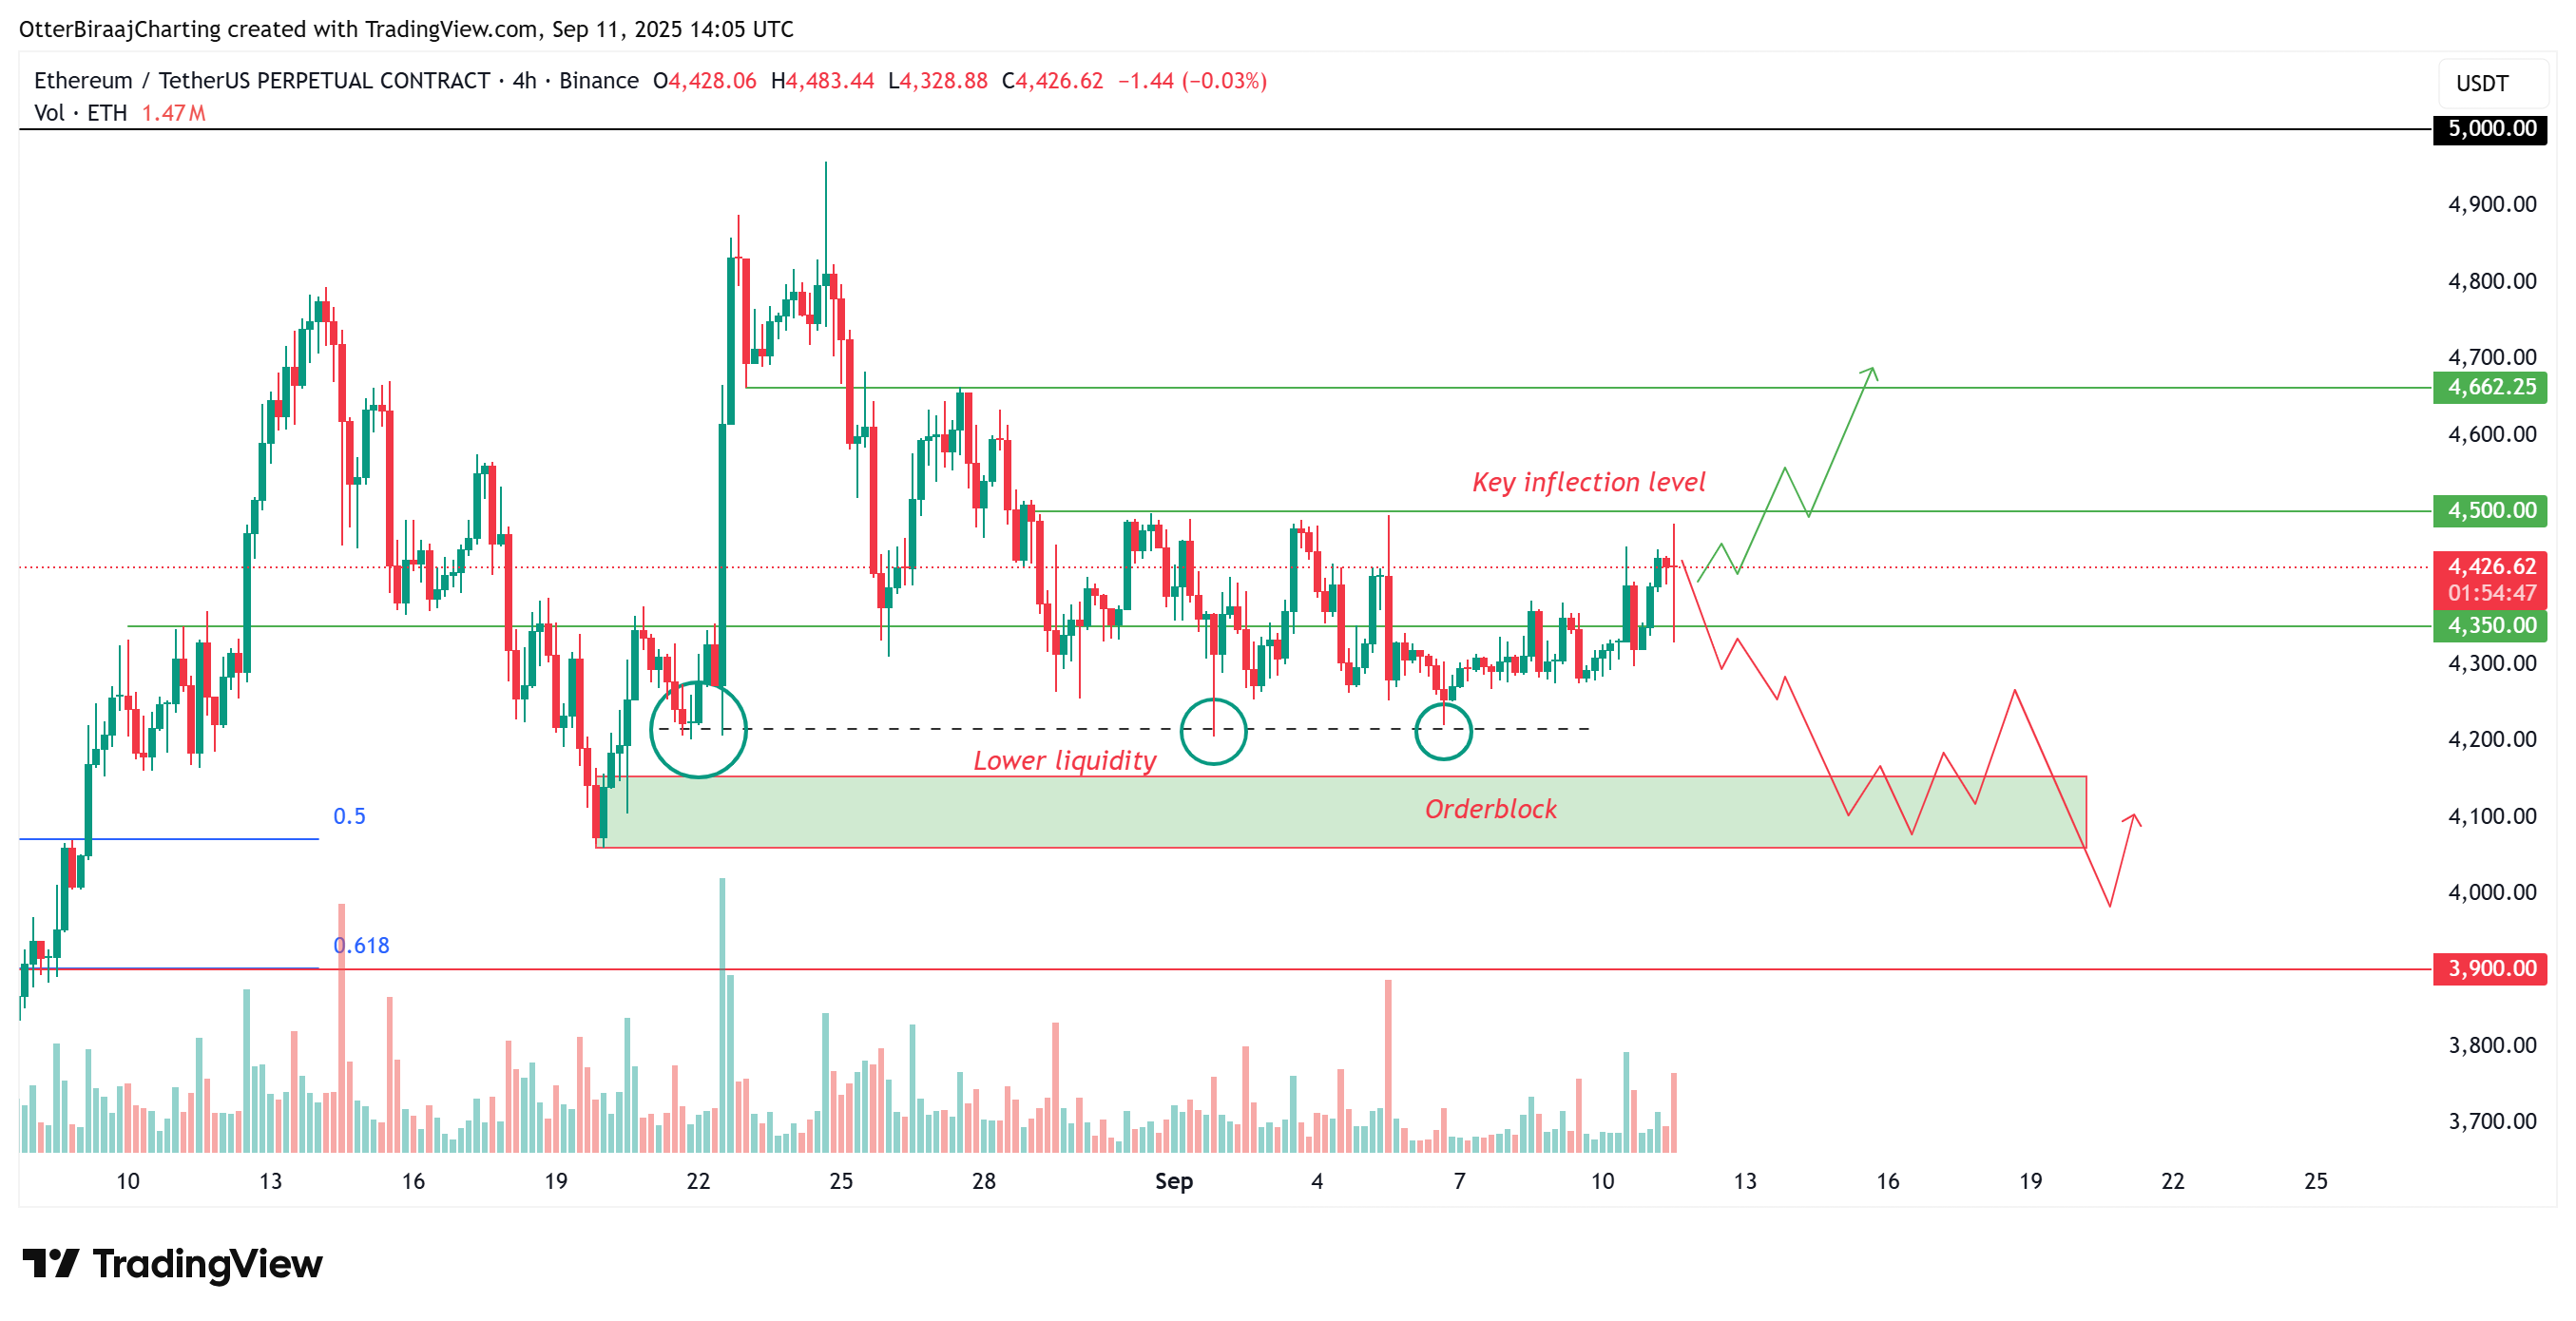
However, the risk of a lower liquidity sweep remains elevated. Key downside levels sit around $4,200, with a notable order block/demand zone between $4,000 and $4,100 positioned just below. If Ether’s price action remains weak going into Q4, a dip toward these zones is possible before any meaningful breakout above $4,500 materializes.
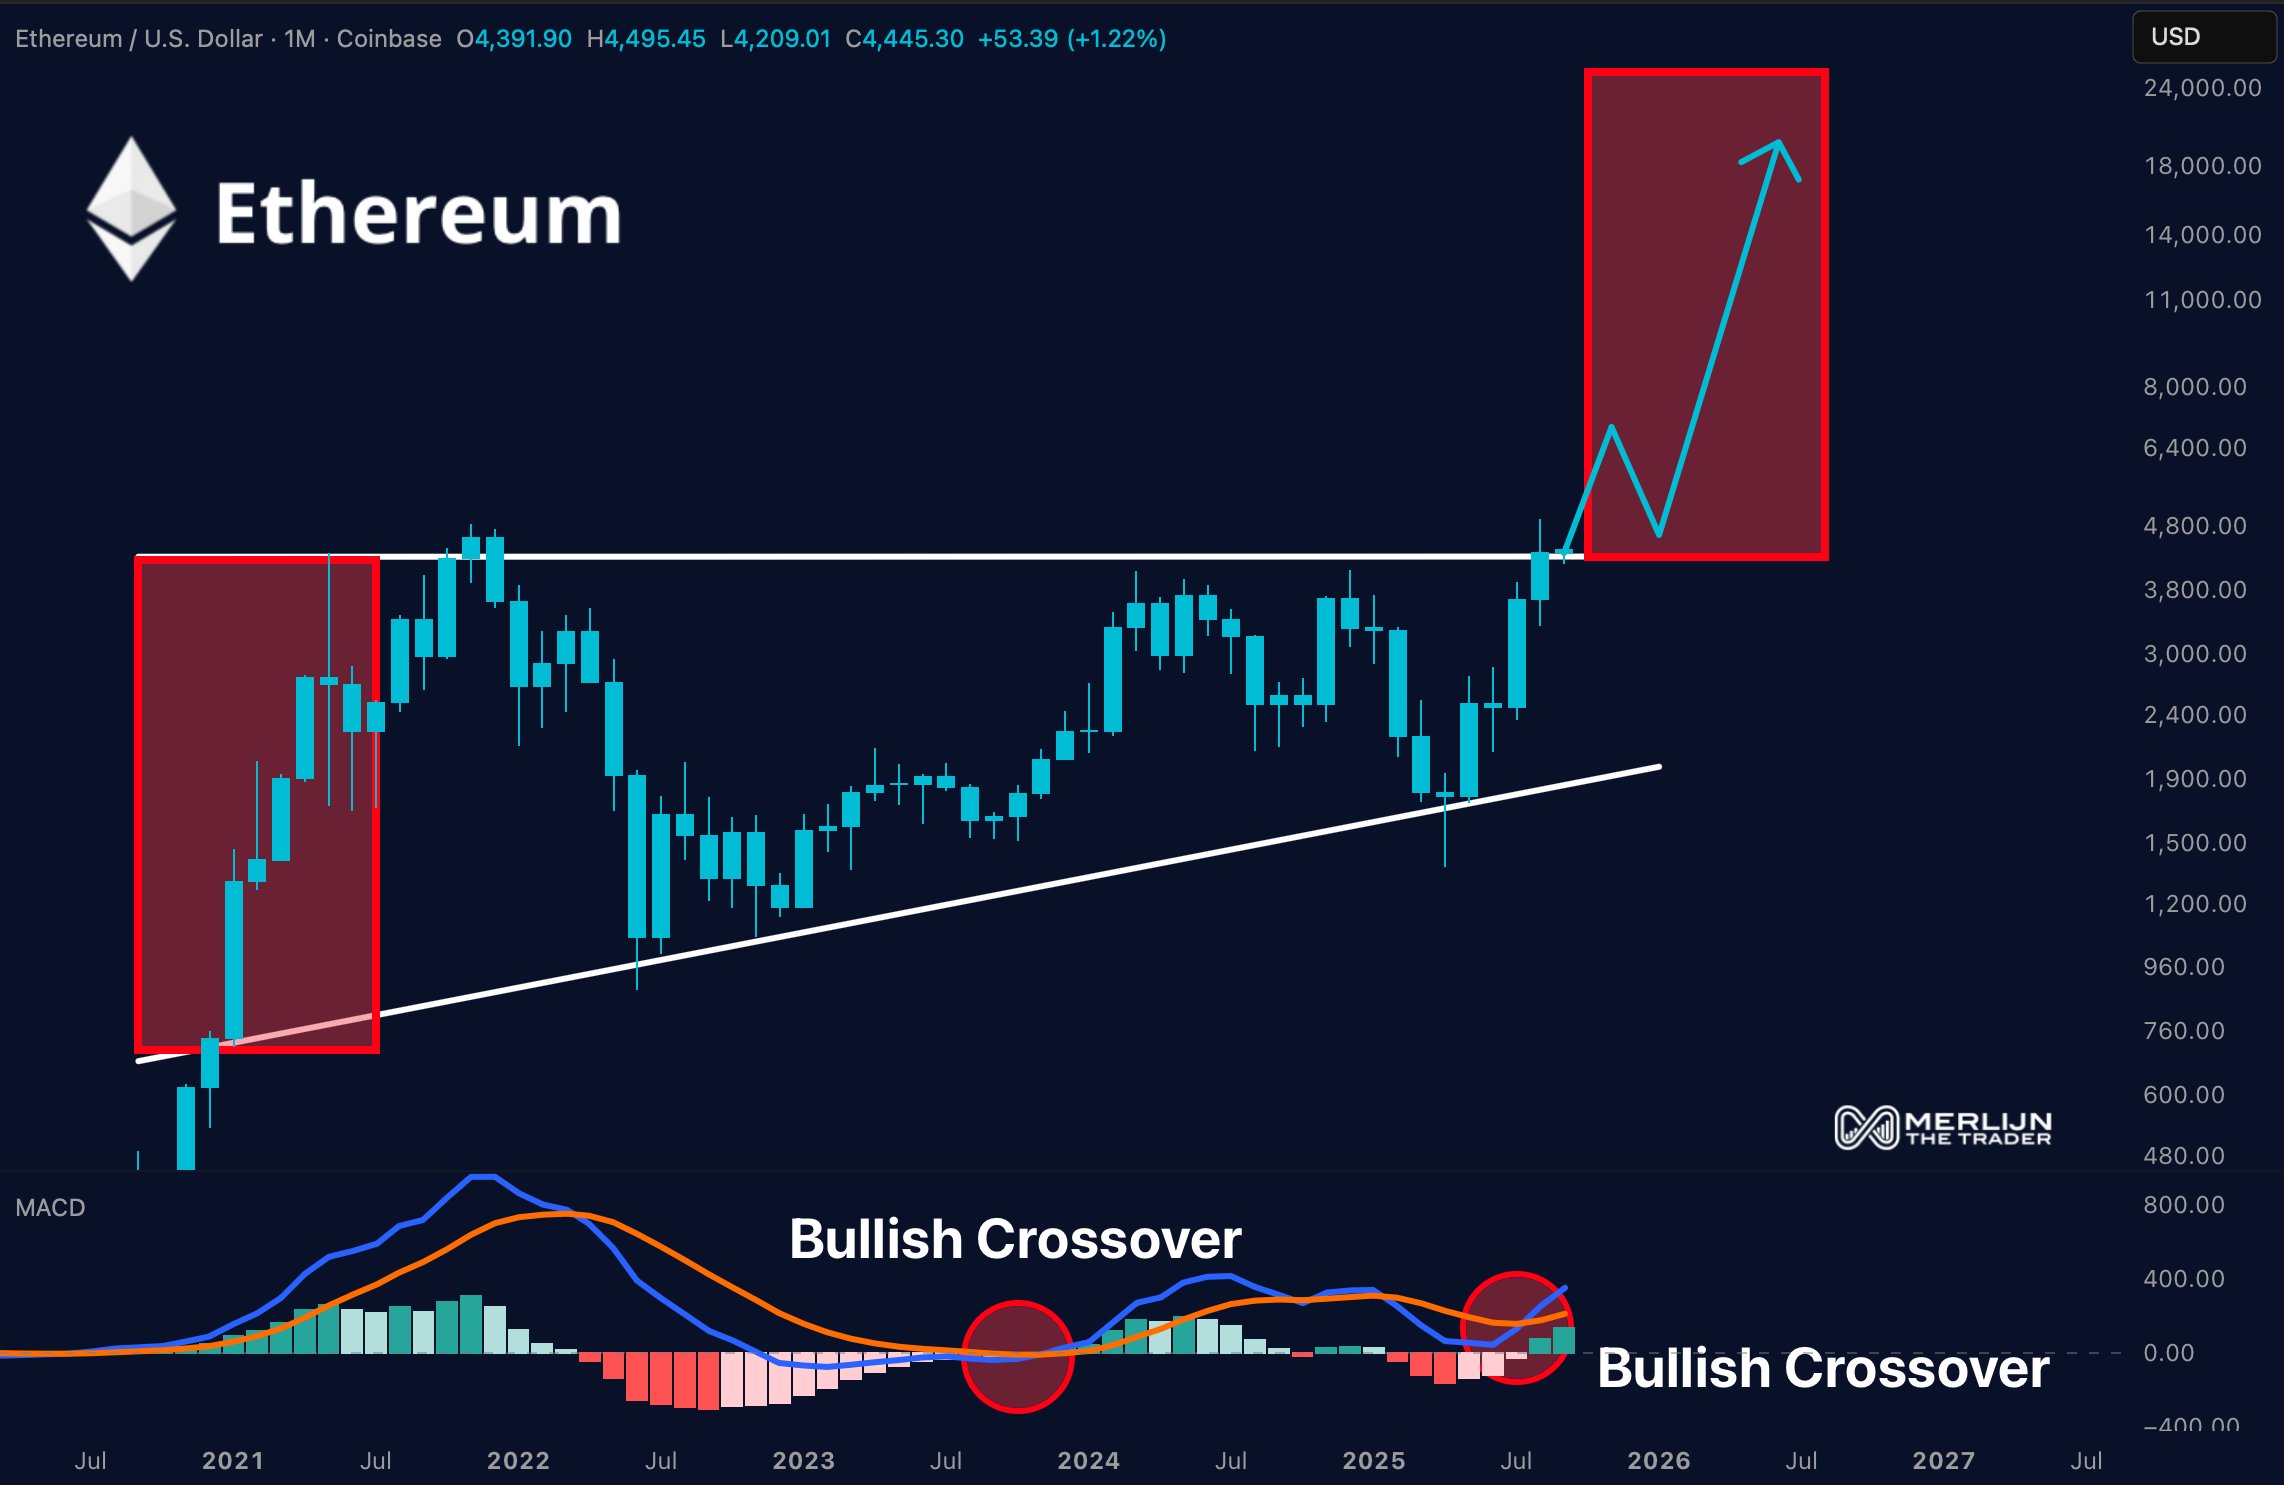
Crypto trader Merlijn believes the likelihood of an immediate rally remains higher as a key monthly indicator turns green. The trader said,
“MACD just flipped green. 3 years of pressure coiled and ready to detonate. Monthly candle says only one word: BULLISH. Clear $4,500 and Ethereum goes parabolic.
This article does not contain investment advice or recommendations. Every investment and trading move involves risk, and readers should conduct their own research when making a decision.
