


Key point:
XRP (XRP) rose to a multi-year high above $3.66 on Friday, indicating aggressive buying by the bulls. That helped XRP’s market capitalization exceed that of the global fast-food giant McDonald’s on Monday. However, the failure to sustain the momentum may have tempted short-term buyers to book profits after the sharp run-up.
What are the critical support and resistance levels to watch out for? Let’s analyze the charts to find out.
XRP price prediction
XRP’s failure to climb above the $3.66 resistance in the past few days has started a pullback below $3.40.
The XRP/USDT pair could plunge to the 20-day exponential moving average ($2.99), which is a critical level to watch out for. If the price turns up from the 20-day EMA with force, it signals buying at lower levels. The bulls will then try to push the price to $3.66. A break and close above $3.66 could thrust the pair to $4 and then to $4.86.
This optimistic view will be invalidated in the near term if the price continues lower and breaks below the 20-day EMA. That suggests the break above $3.40 may have been a bull trap.
Related: Bitcoin grabs bid liquidity as BTC price dip targets include $113K
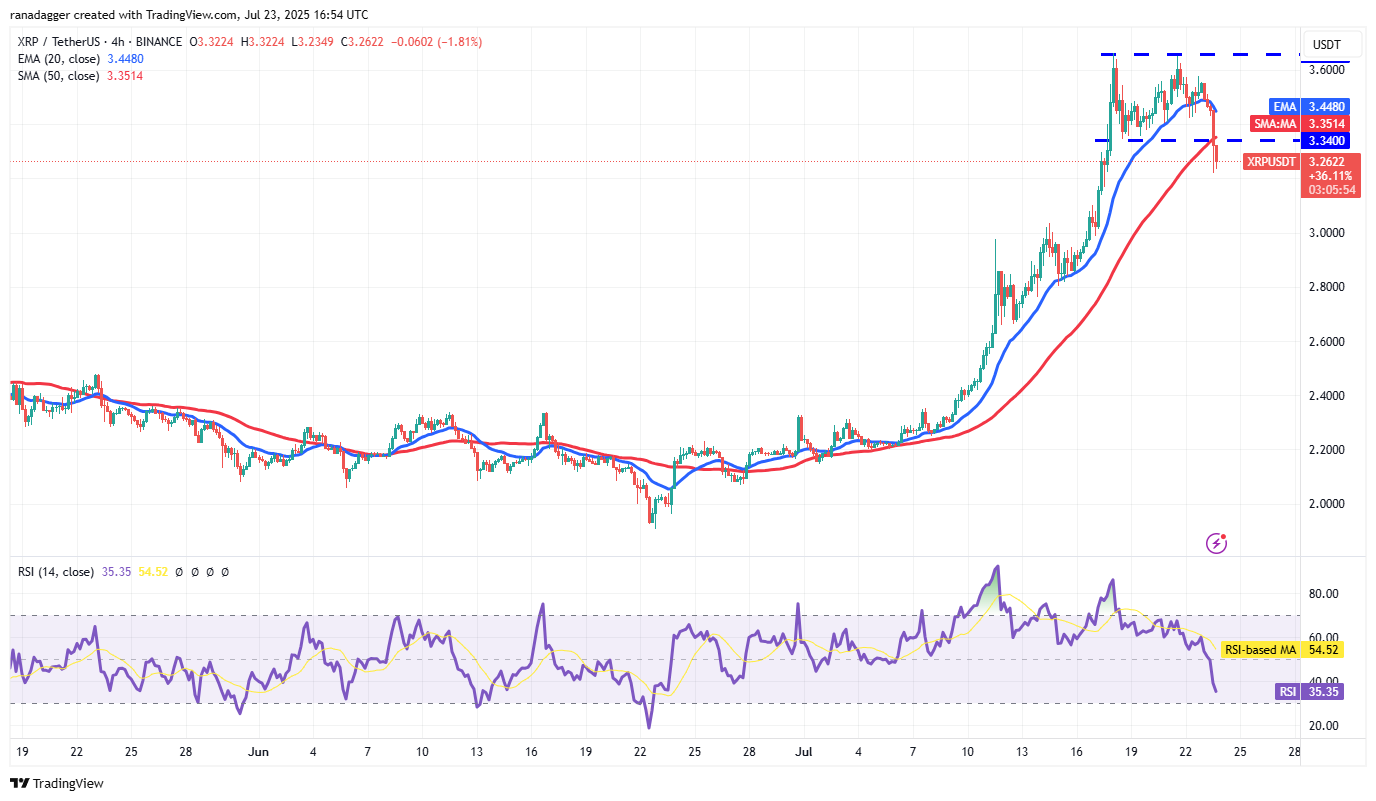
The pair plunged below the $3.34 support, indicating that the bears are trying to make a comeback. The next support on the downside is at $3 and later at $2.80. If the price turns up from the support zone and breaks above the moving averages, it suggests that the corrective phase may be over. The pair could then climb to $3.66.
Instead, if the recovery stalls at the 20-EMA, it suggests a change in the sentiment from buying on dips to selling on rallies. That increases the risk of a deeper fall to $2.60. Such a move may delay the resumption of the uptrend.
This article does not contain investment advice or recommendations. Every investment and trading move involves risk, and readers should conduct their own research when making a decision.
