


Key point:
Hyperliquid (HYPE) has witnessed a strong growth trajectory in the past year, with average trading volume soaring, reaching $3 to $5 billion from less than $100 million, according to CoinGlass’ semi-annual crypto derivatives outlook.
“Hyperliquid accounts for more than 80% of the DeFi perpetual contracts market share,” the report added.
Could Hyperliquid’s growing dominance boost HYPE’s performance? Let’s analyze the charts to find out.
HYPE price prediction
HYPE bounced off the 50-day simple moving average ($37.08) on Tuesday, indicating demand at lower levels.
The gradually upsloping 20-day exponential moving average ($38.43) and the relative strength index (RSI) just above the midpoint indicate a slight edge to the bulls. The HYPE/USDT pair could rise to $41.23, which is a crucial overhead resistance. If this level is scaled, the pair could surge to $44 and later to $45.80.
The 50-day SMA is the critical support to watch out for on the downside. A break below the level could sink the pair to $35.33 and subsequently to $30.69.
Related: Bitcoin to test $110K as macro analysis tells traders to ‘buckle up’
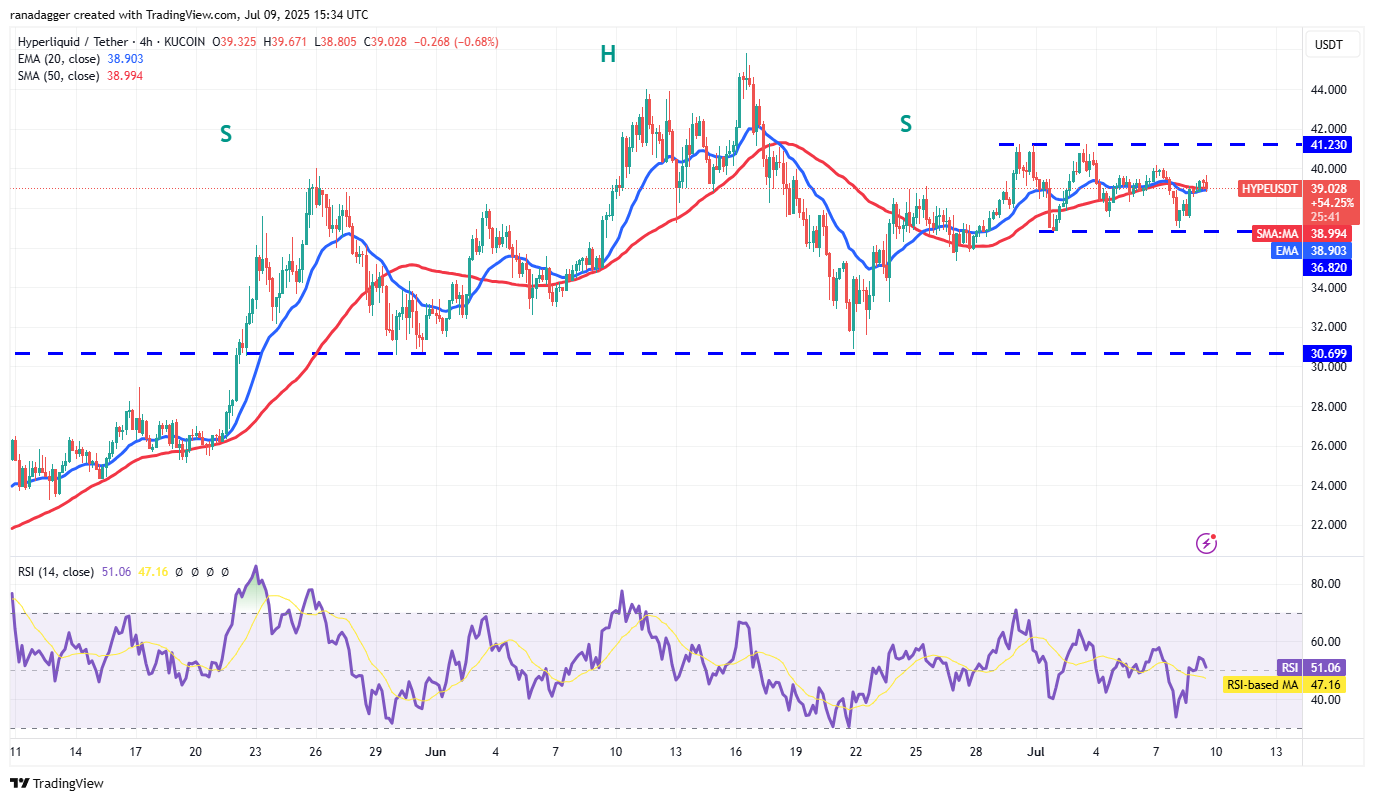
The pair has been consolidating between $36.82 and $41.23 on the 4-hour chart. The flattish moving averages and the RSI near the midpoint do not give a clear advantage either to the bulls or the bears.
If the price remains above the moving averages, the pair could rise to $40 and later to $41.23. A break above $41.23 signals that buyers have overpowered the bears. That could start a rally toward $44.
Conversely, if the price slips and maintains below the moving averages, the pair could slump to the solid support at $36.82.
This article does not contain investment advice or recommendations. Every investment and trading move involves risk, and readers should conduct their own research when making a decision.
