


Key point:
Lawmakers with the US Senate Banking Committee will conduct a hearing on Wednesday titled “From Wall Street to Web3: Building Tomorrow’s Digital Asset Markets,” and Ripple CEO Brad Garlinghouse is one of the participants.
Could Ripple’s growing involvement in policy discussions in Washington, D.C boost the price of XRP (XRP)? Let’s analyze the charts to find out.
XRP price prediction
XRP has broken above the $2.34 overhead resistance, indicating that the bulls are trying to take charge.
The 20-day exponential moving average ($2.23) has started to turn up gradually, and the RSI has jumped into positive territory, indicating that the path of least resistance is to the upside. If buyers sustain the price above $2.34, the XRP/USDT pair could rise to $2.48 and eventually to $2.65. Sellers are expected to pose a strong challenge at $2.65.
The moving averages are the vital near-term support to keep an eye on. If the price turns down sharply and breaks below the moving average, it suggests that the break above $2.34 may have been a bull trap. The pair could then sink to $2.
Related: LetsBonk overtakes Pump.fun: Are Solana memecoins back for good?
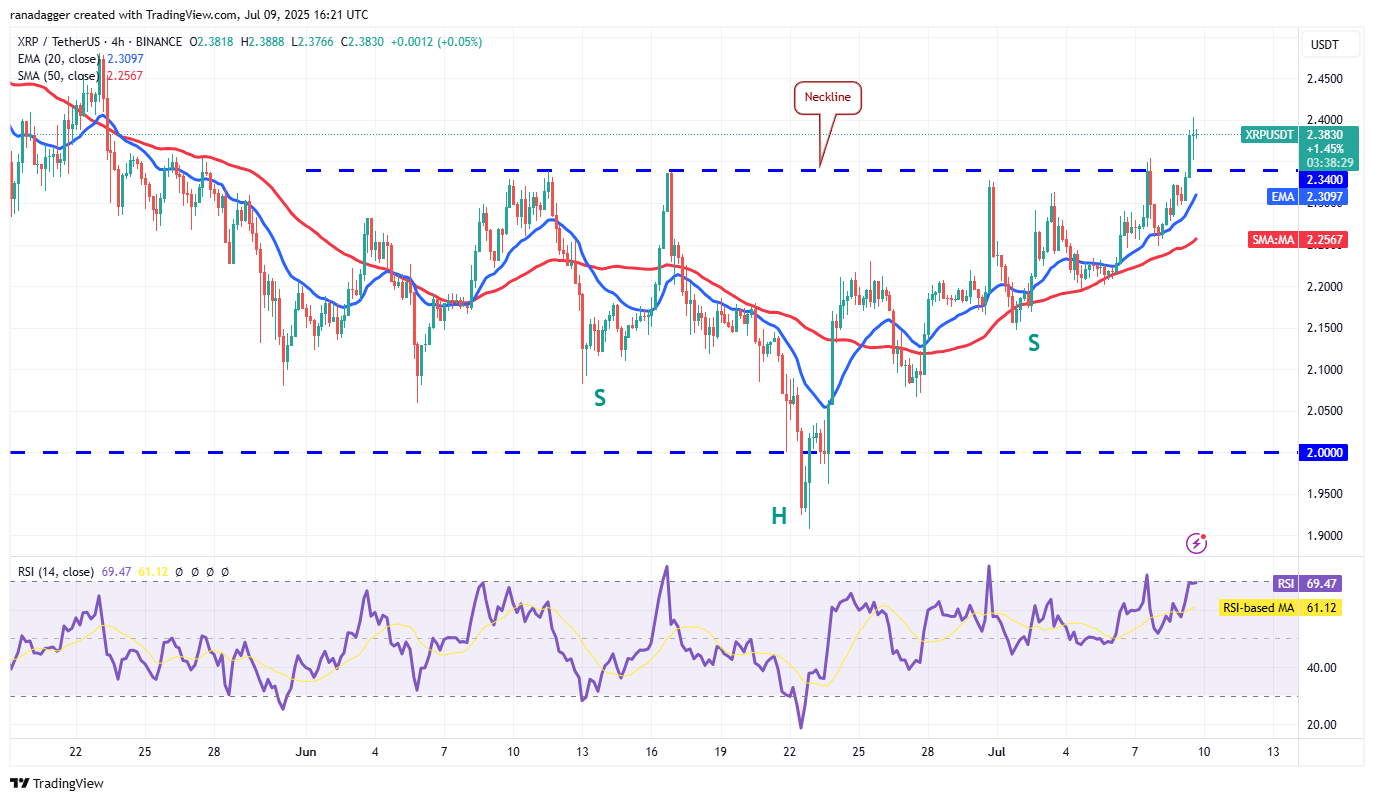
The close above $2.34 on the 4-hour chart completed the bullish inverse head-and-shoulders pattern. The pair could rally to $2.48, where the bears are expected to mount a strong defense. If buyers overcome this barrier, the pair could soar to the pattern target of $2.76.
This bullish view will be invalidated in the near term if the price turns down sharply and breaks below the 50-SMA. That signals the markets have rejected the break above $2.34. The pair may then plummet to $2.15.
This article does not contain investment advice or recommendations. Every investment and trading move involves risk, and readers should conduct their own research when making a decision.
