

 up today?")
Key points:
-
Ethereum price is up 7% on June 10 to trade above $2,680.
-
ETH’s record open interest, rising funding rates and consistent ETF inflows fuel the rally.
-
Ether’s bullish cup-and-handle pattern targets $4,100.
Ether’s (ETH) price was trading at $2,679 on June 10, up more than 7% in the last 24 hours. Its daily trading volume has jumped 114% to $26.5 billion, reinforcing the intensity of the demand-side activity.
Let’s look at the factors driving the ETH price up today.
Ethereum ETPs maintain their inflow streak
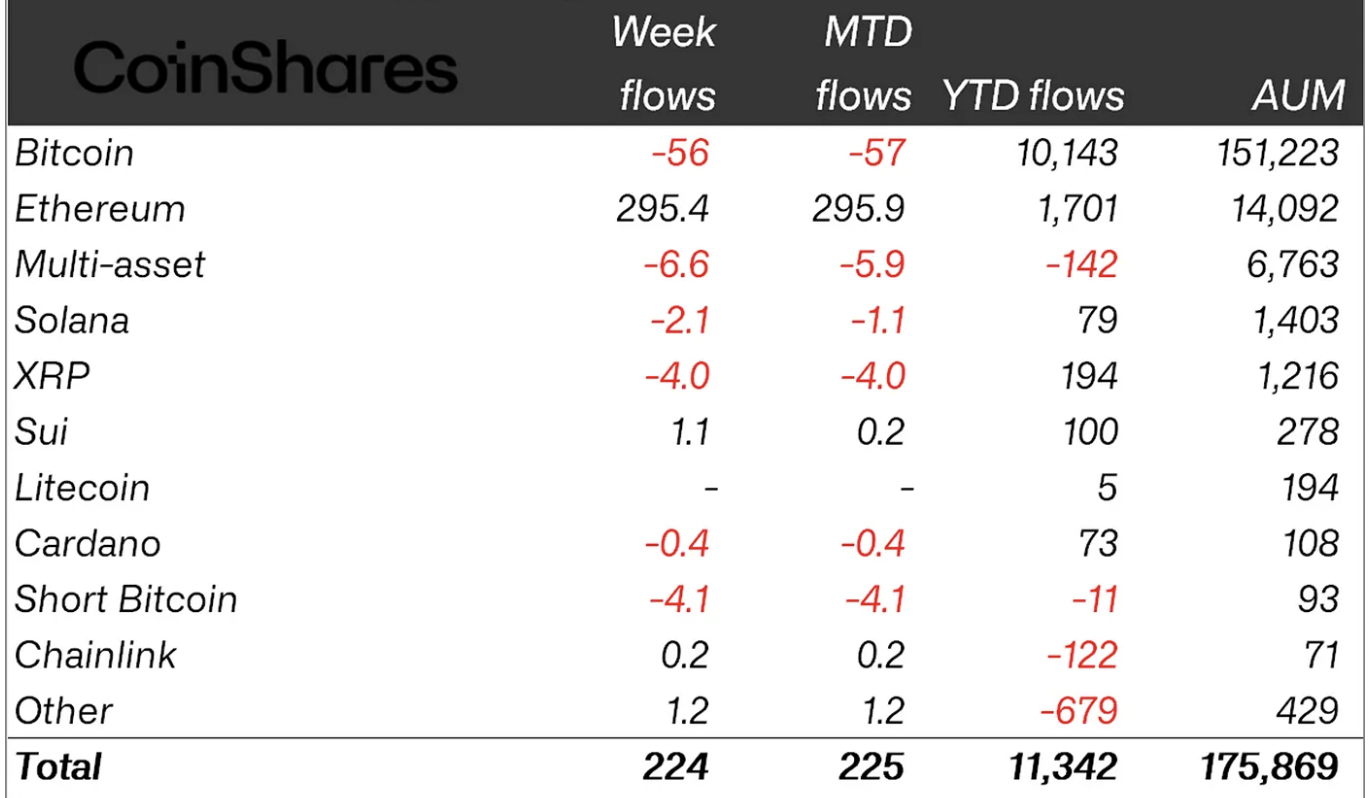
Global Ethereum-based investment products continued their positive streak last week, with net inflows of $295.4 million, according to CoinShares. The products have now recorded a seventh straight week of inflows, totaling $1.5 billion.
CoinShares head of research James Butterfill said:
“This represents the strongest run of inflows since the US election last November and marks a significant recovery in sentiment among investors.”
US-based spot Ethereum ETFs, led by BlackRock’s iShares Ethereum Trust (ETHA), recorded inflows totaling $52.7 million on June 9 and registered 16 consecutive days of inflows amounting to $890 million.
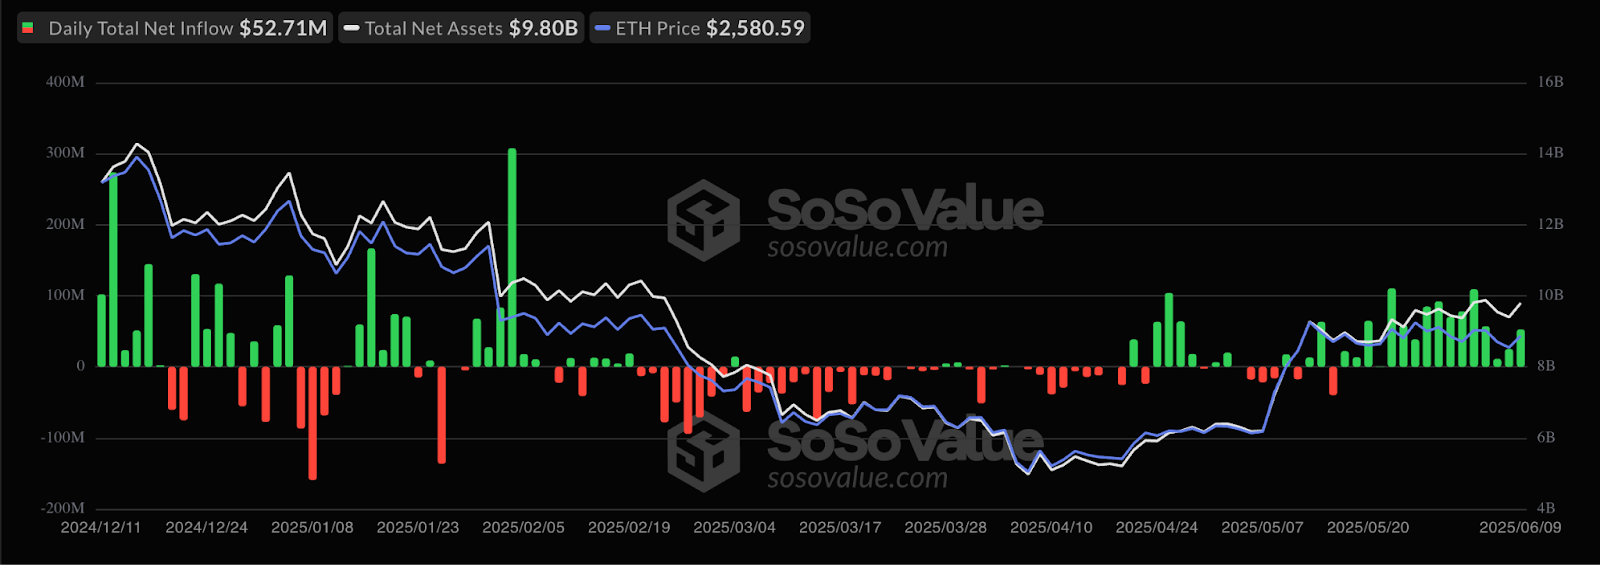
These inflows indicate investor “sentiment shift” toward ETH investment products and point to renewed institutional interest, said trading firm QCP in a June 10 Telegram note to subscribers, adding:
“This rotation suggests a broadening thesis, from Bitcoin as digital gold to Ethereum as the infrastructure layer for real-world assets.”
ETH open interest hits all-time highs
Ether futures open interest (OI) hit a record high on June 10. This suggests that large investors are positioning for a potential rally toward $3,000.
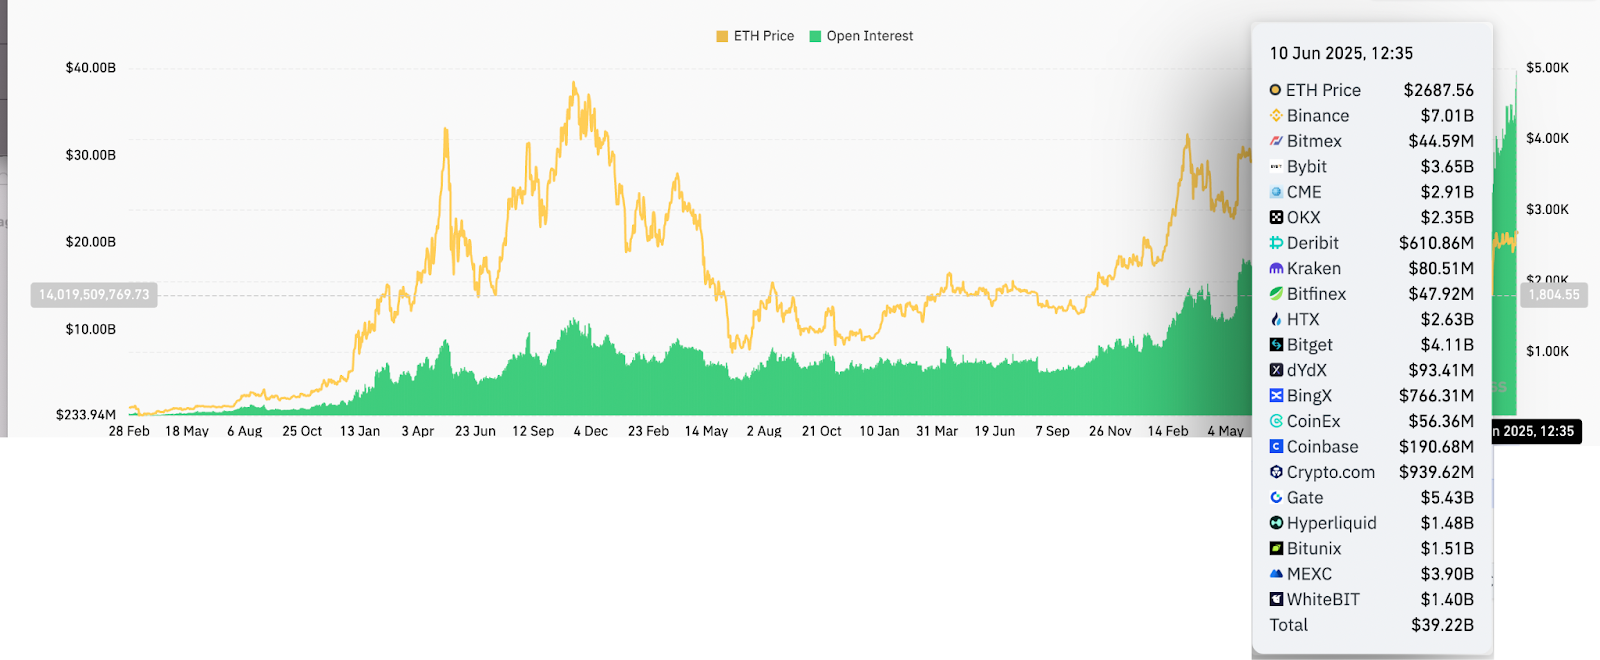
The aggregate OI in Ether futures rose 12.7% in the last 24 hours, hitting a record $39.22 billion on June 10. Binance, Gate.io, Bybit, and Bitget control over 51% of the market, while the Chicago Mercantile Exchange (CME) holds 7.4% of ETH open interest, according to CoinGlass data.
Related: Staked Ethereum hits all-time high as ETH tops $2.7K
Also backing Ether’s upside are positive funding rates in ETH perpetual futures markets. Funding rates represent the periodic payments exchanged between long and short-position holders. This metric has increased to 0.0070% on June 10 from $0.0026% over the last 48 hours.
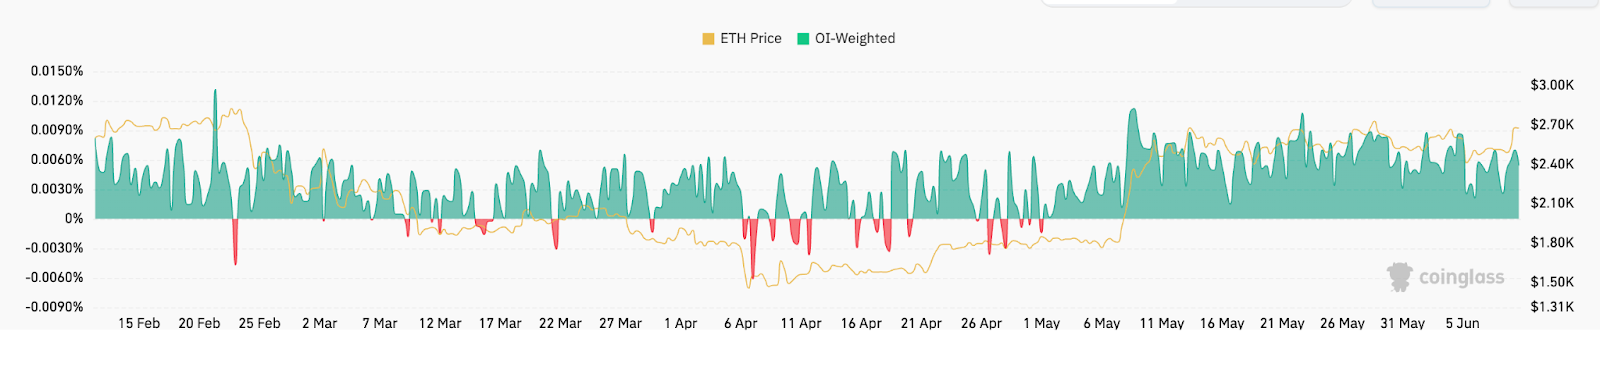
This rise in OI shows more money entering the market. While higher funding rates indicate that more traders are going long (betting on higher prices) and are willing to pay to keep those positions open.
Both metrics signal bullish bias among ETH futures traders.
Ether’s cup-and-handle chart pattern eyes $4,100
From a technical perspective, the ETH/USD pair has been forming a cup-and-handle chart pattern on its daily chart time frame since Feb. 3.
A cup-and-handle setup is a technical pattern that appears when the price falls initially, followed by a steady recovery in what appears to be a U-shaped recovery, which forms the cup. The recovery leads to a pullback move, wherein the price trends lower inside a descending channel, forming the handle.
The pattern is resolved when the price breaks above the pattern’s neckline, rallying as high as the length of the prior decline. The ETH/USD daily chart below illustrates a similar bullish technical setup.
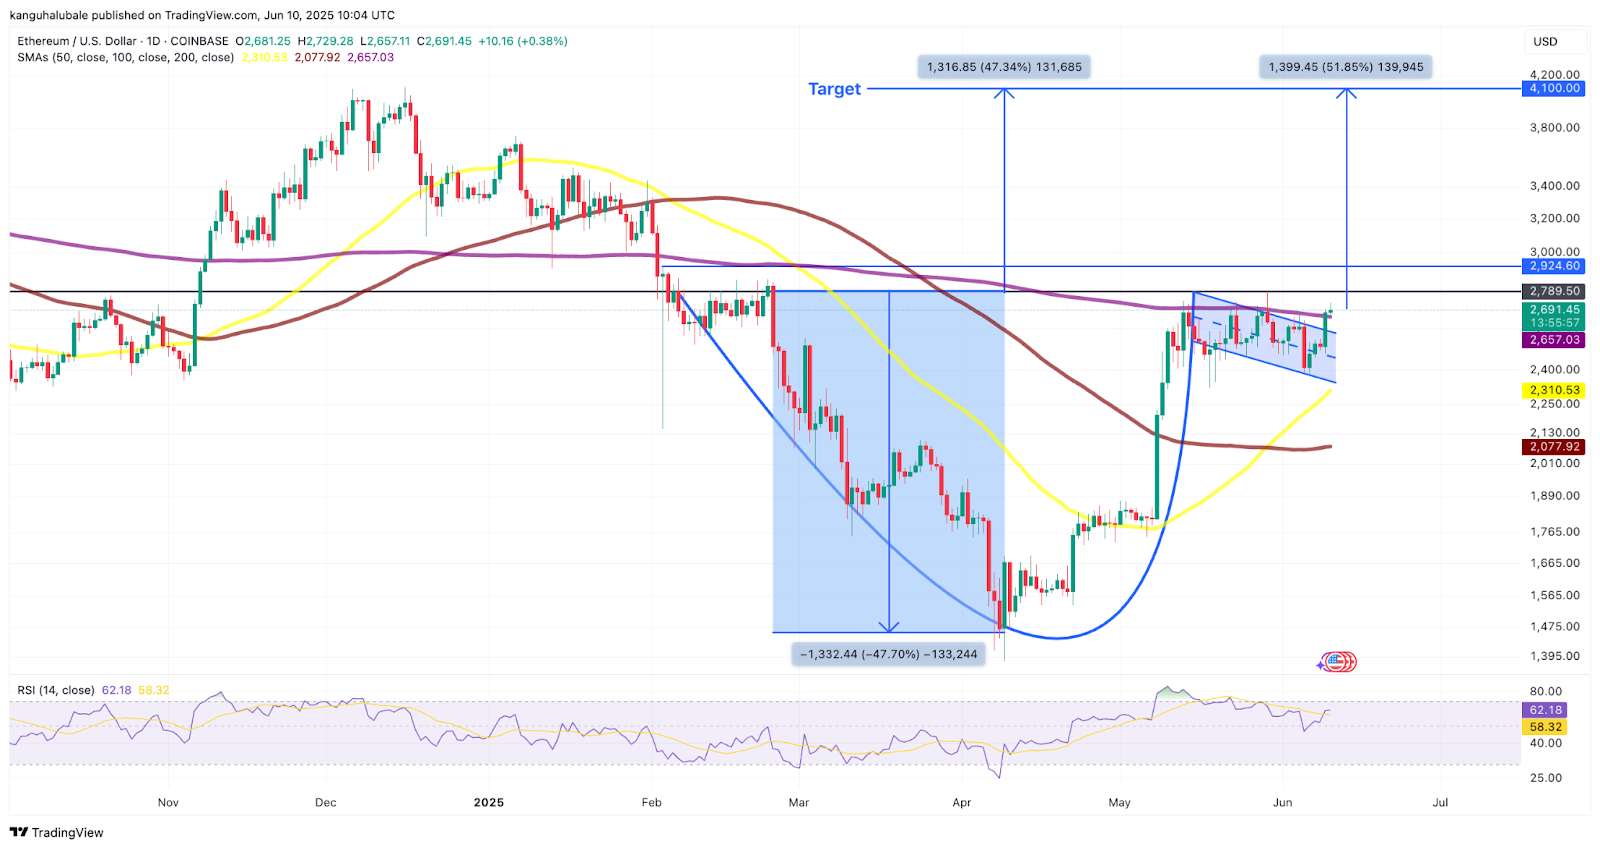
Note that ETH now trades above the handle range and is pursuing a recovery toward the neckline resistance at $2,789.
A decisive daily candlestick close above the neckline could lead the Ether price to confront resistance at the $3,000 range high.
Breaking this barrier would clear the path toward the technical target of the prevailing chart pattern above $4,100, up 52% from the current level.
Several analysts share this outlook, with MN Capital founder Michael van de Poppe saying that ETH price needs to overcome resistance between $2,800-$3,000 before embarking on the “next leg up.”
“I assume we’ll start to see a leg to $3,400-$3,500 if it breaks the resistance at $2,800.”
As Cointelegraph reported, the ETH/USD pair must break the resistance at $2,739 for the price to rally past $3,000.
This article does not contain investment advice or recommendations. Every investment and trading move involves risk, and readers should conduct their own research when making a decision.
